- Docs
- SaaS Shield
- Suite
- Tenant Security Proxy
- Deployment
Tenant Security Proxy Deployment
The Tenant Security Proxy (TSP) Docker container includes health check endpoints and some configuration options. We also have recommended starting points for computing resources and examples of deployment files that may be helpful in creating your own deployments.
Installation
The overview includes instructions for obtaining the Docker container image, obtaining the required configuration, and getting it running in a Kubernetes environment or locally in Docker. You can also check the Tenant Security Logdriver (TSL) overview and deployment sections to see how you can start the TSP (version 4.0.0 and after) and TSL together in your Kubernetes or local Docker environment.
Configuration
Outside of the configuration mentioned in the overview, there are several optional environment variables that allow for tuning. In general it is recommended that you don’t specify these (which will cause the container to use the default values) unless you are instructed to adjust them to resolve an issue.
API_KEY_2. Default: Disabled. Optional second API key that can be used for authorization. Intended to be used when rotating API keys.TSP_EVENT_LOG_CHANNEL_SIZE. Default: 25000. The number of security events the TSP buffers between its request handlers and its event sender. Once this is full, further events are dropped rather than queued.TSP_BIND_ADDRESS. Default: 0.0.0.0. IP address to bind for all services. This setting applies to all interfaces bound by the TSP, unless overridden by a more specific setting as listed below.TSP_HTTP_BIND_ADDRESS. Default:TSP_BIND_ADDRESS:7777. IP or IP:PORT address to bind for the HTTP service used by the Alloy SDK. This is also where/metricsis served.TSP_HEALTH_BIND_ADDRESS. Default:TSP_BIND_ADDRESS:9000. IP or IP:PORT address to bind for the health service.AWS_ENDPOINT_URL. Default: null. URL for where to send AWS requests. This is for use with testing using LocalStack. It should not be set in production deployments.
Security Event Delivery
The TSP delivers security events to the Tenant Security Logdriver over HTTPS. The TSP is the client, so a single address can front a whole pool of TSLs, and the TSP rebalances across that pool on its own as instances are added, drained, or shed load.
Delivery is off unless TSP_LOGDRIVER_URL is set. A TSP without it starts normally, logs a warning, and serves encrypt and decrypt as usual.
TSP_LOGDRIVER_URL. Default: unset, which disables security event delivery. Address security events are POSTed to, expected to front a pool of TSLs: a Kubernetes Service, a load balancer, or a DNS name resolving to several.TSP_LOGDRIVER_CERT_FINGERPRINT. Default: unset. Base64 SHA-256 digest of the DER form of the certificate that pool serves. Required whenTSP_LOGDRIVER_URLishttps://. The certificate is matched by digest rather than by name, so it can be self-signed with no SAN covering the address you reach it at and no CA. Produce the digest withopenssl x509 -in tsl.crt -outform DER | openssl dgst -sha256 -binary | base64.TSP_LOGDRIVER_AUTH_TOKEN. Default: unset. Shared secret this TSP presents on every batch as a bearer token. Required whenTSP_LOGDRIVER_URLishttps://. You choose the value; it is not issued by IronCore, andopenssl rand -base64 32produces a suitable one. The identical string must be set asLOGDRIVER_INGEST_AUTH_TOKENon every TSL in the pool. Only one token is accepted at a time, with no second-token overlap of the kindAPI_KEY_2provides for the TSP’s own API, so rotating means deploying new TSP/TSLs together. While the two disagree the TSL answers401; the TSP logs the mismatch, retries with backoff and keeps queueing, so a brief mismatch costs nothing while a sustained one fills the queue and then starts dropping events.TSP_LOGDRIVER_COMPRESS. Default: false. gzip each batch of security events before sending it. The TSL inflates the batch on its request path, trading throughput for bandwidth. Turn it on only if traffic from your TSPs to your TSLs crosses a boundary you are billed egress on and that cost matters more to you than events per second.
Batches are flushed at whichever of 500 events, 4MB, or 100ms comes first. A 204 from the TSL means it has accepted the batch. Delivery is at-least-once, so a batch whose outcome was uncertain is retried and may be counted twice by the consumer.
Health and Liveness Checks
The Docker container also exposes endpoints for checking liveness and health of the container. The checks are implemented based on the Kubernetes lifecycle concepts. The exposed URLs and their meaning are
/health: Returns a200status code when the container is ready to accept requests. Returns a500status code when the server is shutting down or is still initializing./live: Returns a200status code when the container is not shutting down. Returns a500status code when the server is shutting down./ready: Returns a200status code when the container is ready to accept requests. Returns a500status code when the server is not ready to accept requests.
The container will not report READY until it has retrieved and decrypted the initial set of tenant KMS configurations from the Configuration Broker. Each of these health endpoints is running by default on port 9000 within the Docker image.
Graceful Shutdown
On SIGTERM the TSP stops reporting ready, then drains its queued security events to the TSL for up to 15 seconds, logging whether that drain finished. Allow at least that much time before the process is killed; Kubernetes’ default terminationGracePeriodSeconds of 30 is enough. With a shorter grace period SIGKILL arrives mid-drain and whatever is still queued is discarded with nothing logged, since the process is gone before it can report.
Metrics
Each TSP container provides the following Prometheus metrics on a /metrics endpoint.
tsp_request_duration_seconds (histogram)
- Processing time (in seconds) for a TSP request. The start time for this is when work on a request begins, so it’s mostly useful to see the time it takes to work requests (leased and unleased). If you’re planning to scale on request duration, use external numbers coming from your ingress or load balancer for more accurate scaling.
- Labels:
endpoint- TSP endpoint that was calledkms_type- current primary KMS for the tenanthttp_code- HTTP code being returned to the callertsp_status_code- TSP status code being returned to the caller
tsp_kms_request_duration_seconds (histogram)
- Observed latency for KMS requests
- Labels:
kms_operation- KMS operation type -kms_type- current primary KMS for the tenanthttp_code- HTTP code being returned to the caller
tsp_key_operations_total (counter)
- Number of successful cryptographic operations performed. These operations are primarily the wrapping and unwrapping of document encryption keys; these are counted whether they required a request to an external KMS or were done locally using a leased key. Additional operations include the wrapping and unwrapping of leased keys.
- Labels:
operation- Key operation type
tsp_kms_last_config_refresh_timestamp_seconds (gauge)
- Time (seconds since Unix epoch, UTC) of last successful refresh of the KMS configuration.
- Labels: None
tsp_security_events_produced_total (counter)
- Security events this TSP generated for delivery since startup. This is the denominator for every other event counter; without it a failure count is a bare number rather than a loss ratio.
- Labels: None
tsp_security_events_delivered_total (counter)
- Security events the TSL has acknowledged. Read against
tsp_security_events_produced_total: the difference is events this TSP is still holding or has lost. - Labels: None
tsp_security_events_undeliverable_total (counter)
- Security events discarded because the TSL rejected the batch as malformed, answering
400. Non-zero means a protocol mismatch between the TSP and the TSL rather than load, and these events are discarded rather than retried. Worth alerting on. - Labels: None
tsp_security_event_delivery_retries_total (counter)
- Batch delivery attempts that did not commit. This rises before
tsp_security_event_queue_depthdoes, since a batch retries before the channel behind it fills. Non-zero alongside a rising queue depth is the early warning that consumers are behind or that delivery is misconfigured. - Labels: None
tsp_security_event_queue_depth (gauge)
- Security events buffered between the request handlers and the event sender, bounded by
TSP_EVENT_LOG_CHANNEL_SIZE. This is the leading indicator; drops are the lagging one, and by the time they appear the queue has been full for some time. - Labels: None
tsp_real_time_security_event_failures_total (counter)
- Number of times the TSP has been unable to queue or encode a Real Time Security Event since startup. If this number is over 0, the TSP’s event queue filled and events were dropped. A one-off burst can be absorbed by raising
TSP_EVENT_LOG_CHANNEL_SIZE; sustained increases mean the TSL pool cannot keep up and needs more instances. - Labels: None
tsp_config_refresh_failures_total (counter)
- Number of times the TSP has been unable to refresh its KMS configuration since startup.
- Labels: None
tsp_last_secret_refresh_timestamp_seconds (gauge)
- Time (seconds since Unix epoch, UTC) of last successful refresh of tenant secrets.
- Labels: None
tsp_secret_refresh_failures_total (counter)
- Number of times the TSP has been unable to refresh its tenant secrets since startup.
- Labels: None
The TSP and the TSL count the same events from opposite ends, so whether everything a TSP produced reached a TSL’s durable store is a question with an answer. Allowing for events in flight at the moment you scrape, tsp_security_events_produced_total equals the sum of tsp_security_events_delivered_total, tsp_security_events_undeliverable_total, tsp_real_time_security_event_failures_total, and tsp_security_event_queue_depth. See the TSL metrics for the consumer half of that ledger.
If Prometheus is available in your environment, it can collect these metrics from the TSPs. Once Prometheus has started gathering metrics, you can display them in a variety of ways using Grafana.
A sample Grafana dashboard can be imported from this JSON file: TSP - All Metrics. This dashboard contains a variety of panels relating to request latency, error rates, key operations, and other queries useful for troubleshooting the TSP. The import process for Grafana is described here.
Performance
Expected sustained performance of a 2 CPU TSP should be ~30k operations per second, depending on computing and network resources. The highest we’ve benchmarked was around 150k requests per second through a single 10 CPU TSP.
Key leasing is vital to high throughput numbers, so less time is spent waiting on KMS I/O.
See the TSL expected performance for more details on performance in combination with TSL.
Scaling
The TSP is stateless and scales vertically and horizontally. With logging set to ERROR it handles 12-15k requests per CPU core (depending on clock speed). The time a new instance takes to come up scales linearly with the number of tenants you have (after the first instance expect ~20s of spin-up time for ~1000 tenants).
Our deployment recommendation for most customers is:
- 2 CPU TSPs with 500MB of memory.
- (optional) A pool of 2 CPU TSLs with 1256MB of memory each, fronted by a single address in
TSP_LOGDRIVER_URL. If tenants don’t want log sink support, leaveTSP_LOGDRIVER_URLunset and don’t run them. See the TSL deployment doc for sizing that pool. - A round robin load balancer.
- Scale out 2 new instances of the TSP if CPU usage is above 150% (75% of available) for 20s.
- Scale in by 1 instance if CPU usage is below 50% of available.
This setup will comfortably handle 25-30k requests per second with logging on the TSP set to ERROR. With logging set to INFO expect 15-20k requests per second.
If you expect consistent load higher than that, feel free to provide more resources to the TSP following the 12-15k requests per CPU core guidance if that’s more economical for you than horizontal scaling alone. The 75%/50% of total available CPU usage guidance stays true as cores go up.
TSPs and TSLs scale independently, so growing one does not mean growing the other in step. A 2 CPU TSL sustains around 40,000 events/sec, and a 2 CPU TSP doing nothing but producing events tops out around 24,600 events/sec, so how many TSPs one TSL carries depends on how event-heavy your traffic is. See sizing the pool.
Situations without key leasing enabled on all configs will be some subset of the above, but they’re too dependent on the performance of external systems for us to give accurate blanket guidance; you’ll need to test throughput on your own. Be aware that testing throughput without key leasing enabled will incur costs from the KMS providers, and be subject to rate limiting by them (both of which will also apply for unleased production loads).
Good signals for auto-scaling are the /ready readiness check and CPU usage ~75%.
Resource Usage
Memory
TSP memory usage is linear with the number of tenants. Baseline usage with no tenants is around 2.4MB. A tenant with a few KMS configs takes up around 200KB.
We recommend 500MB as a default that will cover most use cases.
CPU
Most of the TSP’s CPU usage is for serving requests or decrypting KMS configs. Setting a minimum of 2 CPUs ensures that progress can always be made on both decrypting configs and making async KMS calls at the same time. More CPUs will allow for more throughput (at a rate of about 12-15k per CPU) but should be tuned based on what your deployment’s usage looks like.
We recommend 2 CPUs as a default for most use cases.
Failure Modes
Configuration Broker Down
The TSP retrieves KMS configurations for tenants from the Configuration Broker (CB). If the CB is inaccessible or down these things will be true:
- new TSPs will not be able to start up until they can reach the CB to get tenant’s KMS configs
- each TSP container that had already started up successfully will continue to operate with the configs that it previously retrieved for up to 24hrs
- running TSPs will not receive updates from the CB such as disabled configs or updated KMS credentials, which may result in some tenants’ calls to their KMS to fail
TSL Pool Overloaded
A TSL that is behind refuses batches with a 429 and the TSP retries them, so logdriver_batches_shed_total climbing on its own is normal and costs nothing. If the whole pool is saturated the TSP’s queue fills instead: tsp_security_event_queue_depth climbs toward TSP_EVENT_LOG_CHANNEL_SIZE, and once it is full tsp_real_time_security_event_failures_total starts rising as events are dropped. Wrap and unwrap are unaffected throughout; only security events are lost. See the TSL failure modes for more information.
TSL Pool Unreachable
If no TSL answers, the TSP retries with backoff and keeps queueing, so a brief outage costs nothing and a sustained one degrades exactly as an overloaded pool does. The same applies to a bad TSP_LOGDRIVER_AUTH_TOKEN or TSP_LOGDRIVER_CERT_FINGERPRINT: the TSP logs the rejection and keeps retrying rather than exiting. tsp_security_event_delivery_retries_total rising with no matching rise in tsp_security_events_delivered_total is the signal.
Troubleshooting
File Descriptor Limits
When performing batch operations within the Proxy, caution should be used if the batch size is large enough to cause many requests to be made to a tenant’s KMS. When a batch operation is performed, multiple parallel requests will be made to the tenant’s KMS, one for each key to wrap. If the batch size is large enough, this can cause the number of file descriptors requested from the container to exceed the available resources, creating errors. On Linux, the default file descriptor limit is 1024, so it is best to limit the number of items in a batch operation to no more than 1000 at a time.
File descriptor limit errors may also show up if you have enough concurrent traffic flowing through a single TSP deployment. If you notice these errors in the logs and are not submitting large batches, you should either increase the file descriptor limit on that TSP or horizontally scale and load balance the traffic.
Example Deployments
Example Docker Compose
See the TSL documentation for an example of running it and the TSP together using Docker compose.
Example Kubernetes Deployment
In general, we recommend running the Tenant Security Proxy alongside a pool of Tenant Security Logdrivers; for that configuration, see the TSL deployment documentation, which includes the TSP side of it. If you really only need the TSP, this config is a bit simpler. It leaves TSP_LOGDRIVER_URL unset, so no security events are delivered.
YAML# This is the service Tenant Security and Alloy clients call. apiVersion: v1 kind: Service metadata: name: tenant-security-proxy labels: app: tenant-security-proxy spec: type: NodePort ports: - port: 7777 targetPort: 7777 name: http selector: app: tenant-security-proxy --- apiVersion: apps/v1 kind: Deployment metadata: name: tenant-security-proxy spec: selector: matchLabels: app: tenant-security-proxy template: metadata: labels: app: tenant-security-proxy annotations: prometheus.io/scrape: 'true' prometheus.io/port: '7777' spec: securityContext: runAsUser: 2 # Any non-root user will do. runAsGroup: 2 fsGroup: 2 runAsNonRoot: true containers: - name: tenant-security-proxy image: us-docker.pkg.dev/ironcore-images/gcr.io/tenant-security-proxy:{CHOSEN_TAG} resources: # See https://ironcorelabs.com/docs/saas-shield/tenant-security-proxy/overview/#startup requests: cpu: 2 memory: 500MB limits: cpu: 2 memory: 500MB envFrom: - secretRef: # See https://ironcorelabs.com/docs/saas-shield/tenant-security-proxy/overview/#startup name: tsp-secrets env: - name: RUST_LOG value: info # Values are trace, debug, info, warn, error ports: - containerPort: 9000 name: health - containerPort: 7777 name: http livenessProbe: httpGet: path: /live port: health readinessProbe: httpGet: path: /ready port: health securityContext: allowPrivilegeEscalation: false
Autoscaling
For High Availability, we recommend running at least 2 replicas of the TSP in different zones. For most workloads, 2 replicas is
plenty; however, the TSP can easily be scaled up or down. The process is generally CPU bound and we recommend scaling up when available CPU usage is at 75% and down when it’s at 50%. A
typical installation of the Prometheus Custom Metrics Adapter will
implicitly apply sum(...) to the sampled metrics, so a config like this should work:
YAMLapiVersion: autoscaling/v2 kind: HorizontalPodAutoscaler metadata: name: tenant-security-proxy spec: maxReplicas: 10 minReplicas: 2 scaleTargetRef: apiVersion: apps/v1 kind: Deployment name: tenant-security-proxy metrics: # If you're using Kubernetes 1.30 or later, change this to a ContainerResource. - resource: name: cpu target: averageUtilization: 75 type: Utilization type: Resource behavior: scaleUp: stabilizationWindowSeconds: 0 policies: - type: Pods value: 2 periodSeconds: 15 scaleDown: stabilizationWindowSeconds: 120 policies: - type: Pods value: 1 periodSeconds: 15
Frequently Asked Questions
How can I rotate my API key?
You can rotate your API key by using the API_KEY_2 environment variable.
First, you should create a new Service Account Config in the Configuration Broker:
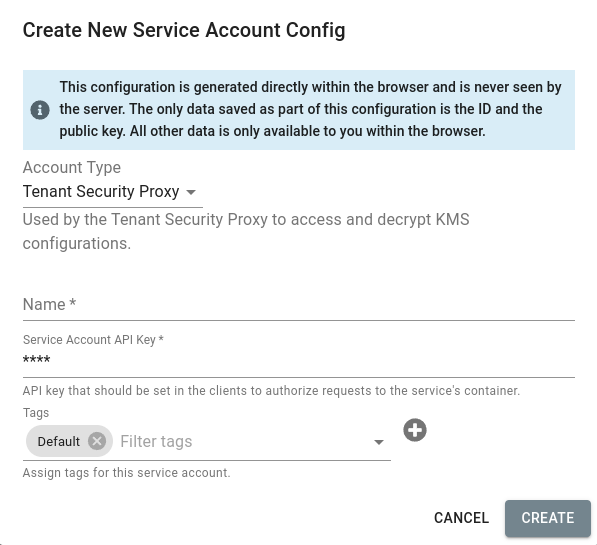
Next, download the new configuration.

Finally, add a new line to the configuration file that sets API_KEY_2 to your previous API key.
NOTE: this not only generates a new API key, it also rotates the private keys used by the TSP to communicate with IronCore’s services, which we encourage periodically. API_KEY_2=<Old API key>
The TSP will now accept requests that use either of these API keys, and after you have updated the configuration of your applications that use the Alloy SDK with the new API key, you can phase out your old key (remove the API_KEY_2 line from the configuration file and restart the TSP).